Suburb Spotlight - Osborne SA 5017
Suburb Overview
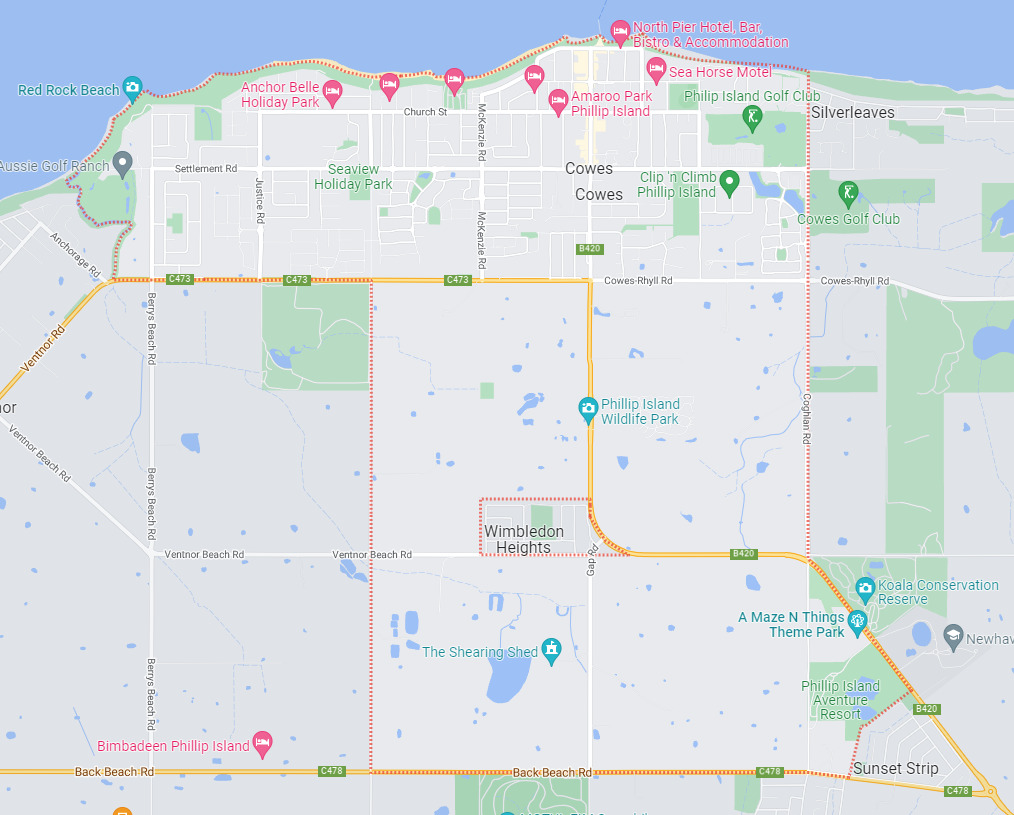
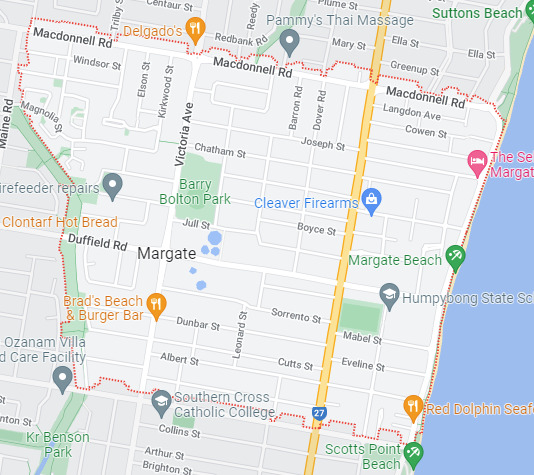
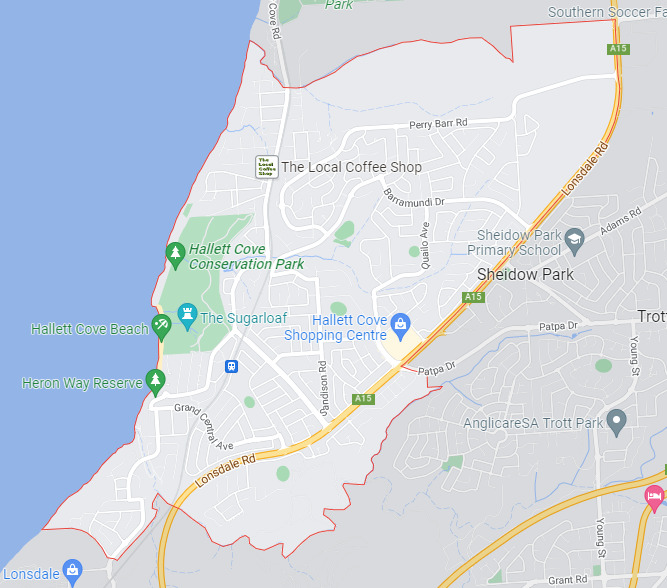
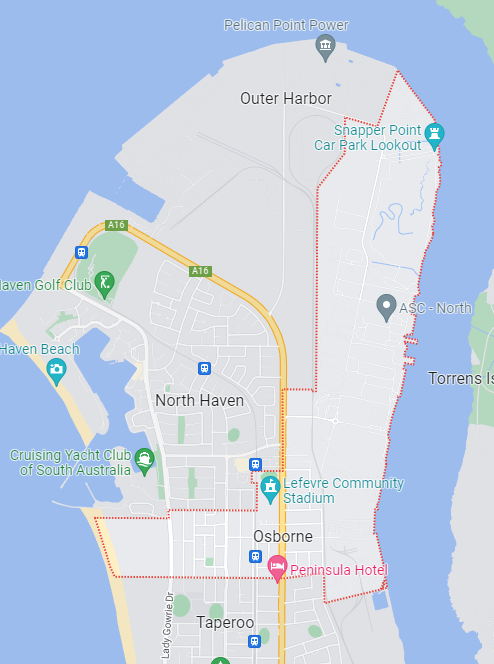
The suburb of Osborne is located within the City of Port Adelaide Enfield. It is located 21 kilometers northwest of Adelaide's Central Business District and in total occupies an area of 5.1 square kilometers.
Suburb Map
The information that follows has been taken from the Australian Bureau of Statistics (ABS) data.
The numbers shown in brackets relate to Australia's aggregate data and are therefore a useful comparison.
Suburb Demographics
The suburb of Osborne has a population of 1 951. The distribution of males compared to females is 47.4% to 52.6% respectively.
The median age of people living in the suburb is 41. This compares with the Australian median age of 38. The largest median age group in Osborne is 40-44 years.
Cultural & Language Diversity
79.8% of residents in the suburb of Osborne were born in Australia. This compares with 66.9% of residents Australia-wide. Excluding Australia, the top 3 countries of birth of residents in Osborne are:
- England 6.4% (3.6%)
- New Zealand 1.0% (2.1%)
- Scotland 1.0% (0.5%)
88.7% of households only speak English at home in Osborne, compared with 72.0% Australia-wide. The top 3 languages other than English spoken at home in Osborne are:
- Italian 0.5% (0.9%)
- Arabic 0.5% (1.4%)
- Uzbek 0.5% (0.0%)
52.0% of residents in Osborne have no religious affiliations. This compares with 38.4% of Australians. Exclusing no religion, the top 3 religious affiliations of residents of Osborne are:
- Catholic 17.2% (20.0%)
- Anglican 8.0% (9.8%)
- Uniting Church 5.1% (2.6%)
Income
The median household income in Osborne is $1 336 compared to the Australian median of $1 746.
Family
Family couples without children and family couples with children 35.7% are jointly the dominant family structure in Osborne, compared with 38.8% and 43.7% Australia wide. Furthermore, this was followed by single-parent families 27.5% (15.9%).
Dwellings
84.4% (72.3%) of dwellings in the suburb of Osborne are separate houses. Semi-detached, terrace houses, townhouses, flats and aprtments make up 15.2% (26.8%) of other dwellings.
The dominant number of bedrooms per dwelling in Osborne is 3, with 65.6% (39.0%). This is followed by 2 bedroom dwellings 18.4% (19.1%).
66.0% (66.0%) of dwellings are either owned outright or with a mortgage in the suburb of Osborne, whilst 31.7% (30.6%) are rented.
37.4% (36.2%) of households have 1 registered motor vehicle. Additionally, 35.2% (36.3%) of households have 2 registered motor vehicles.
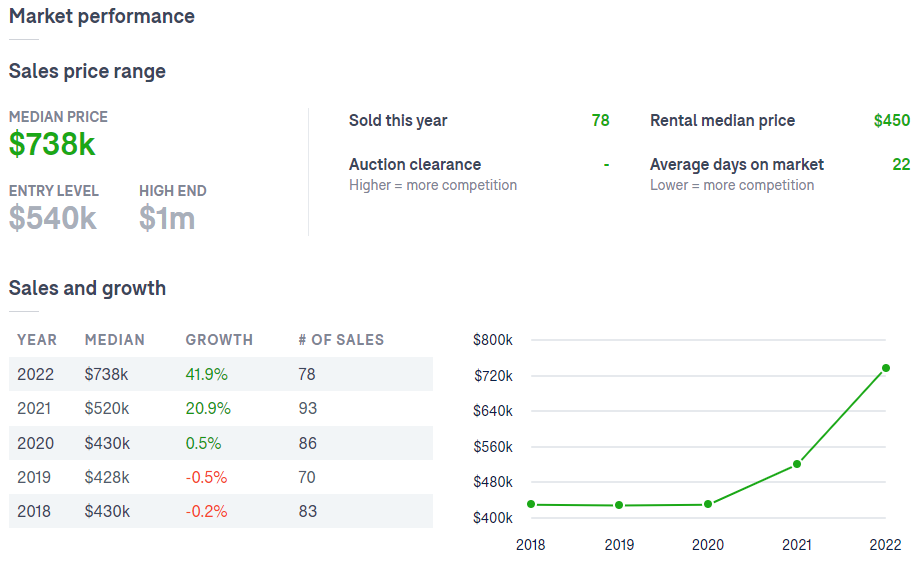
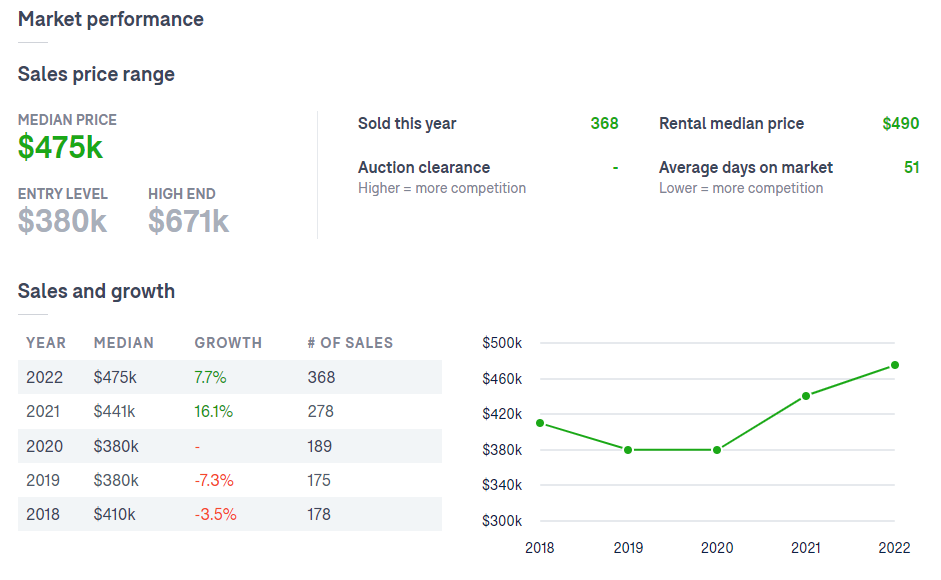
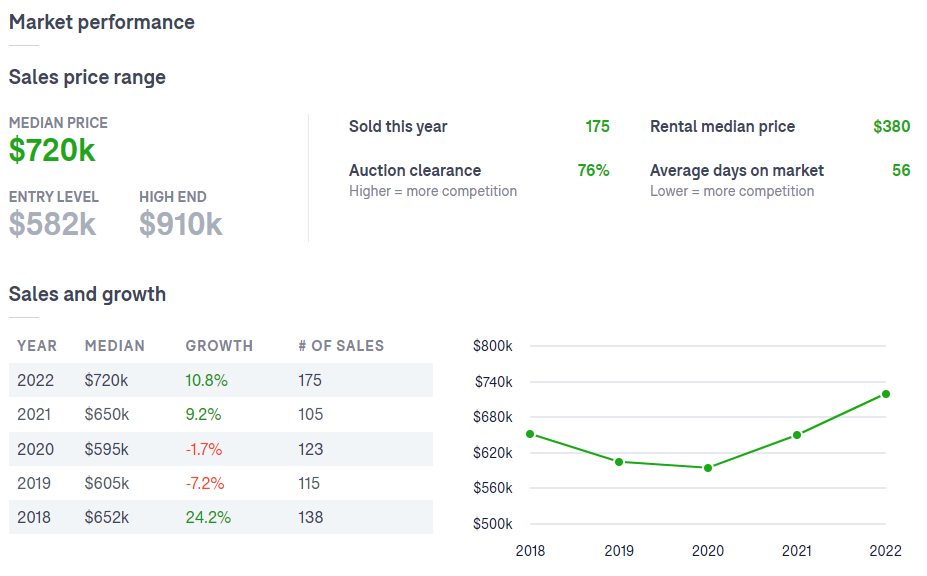
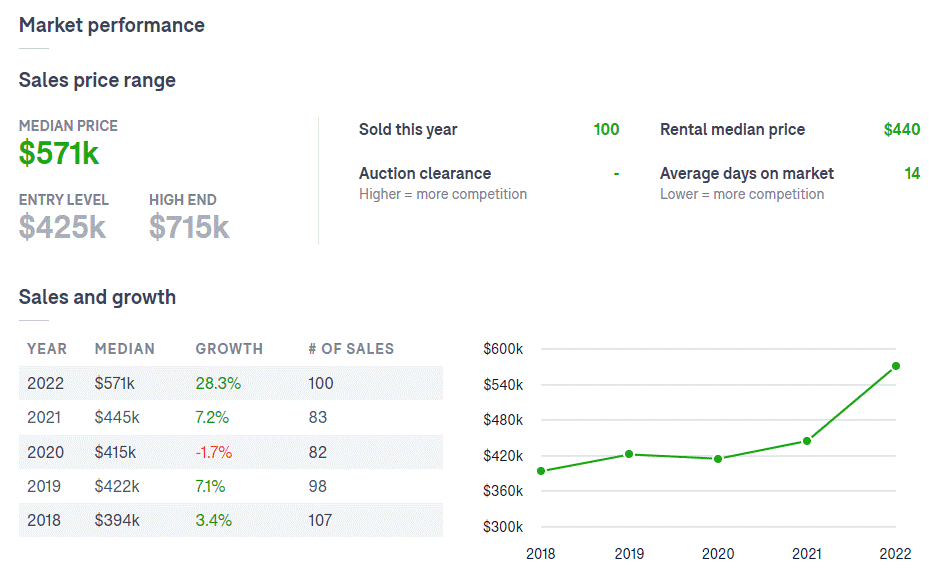
Suburb Market Performance
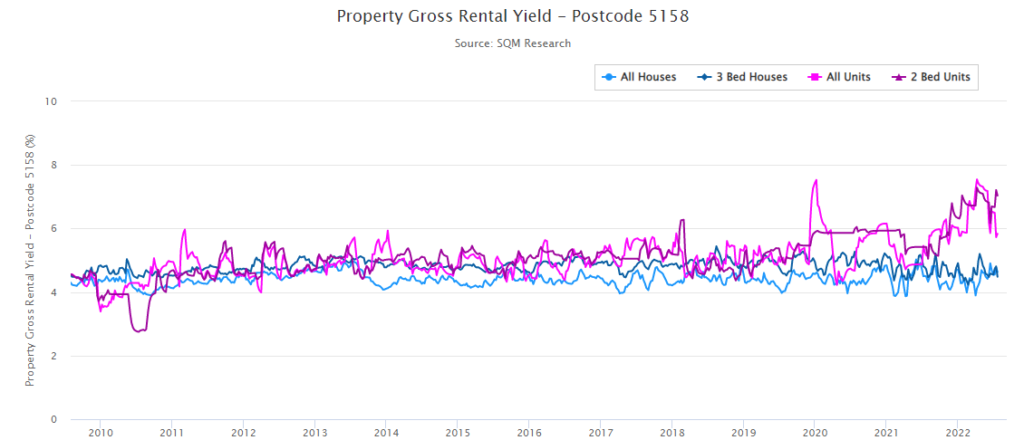
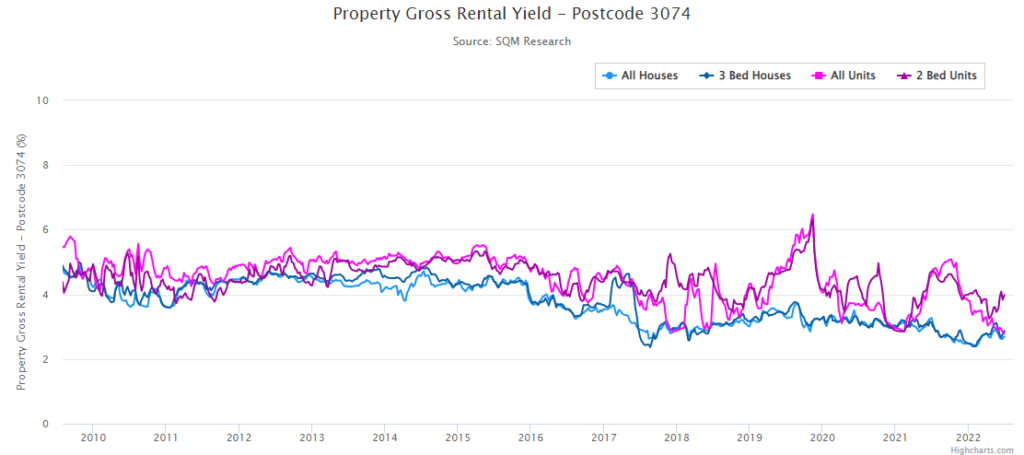
The recent market performance for the most dominant dwelling type, a 3-bedroom house in the suburb of Osborne can be seen below.
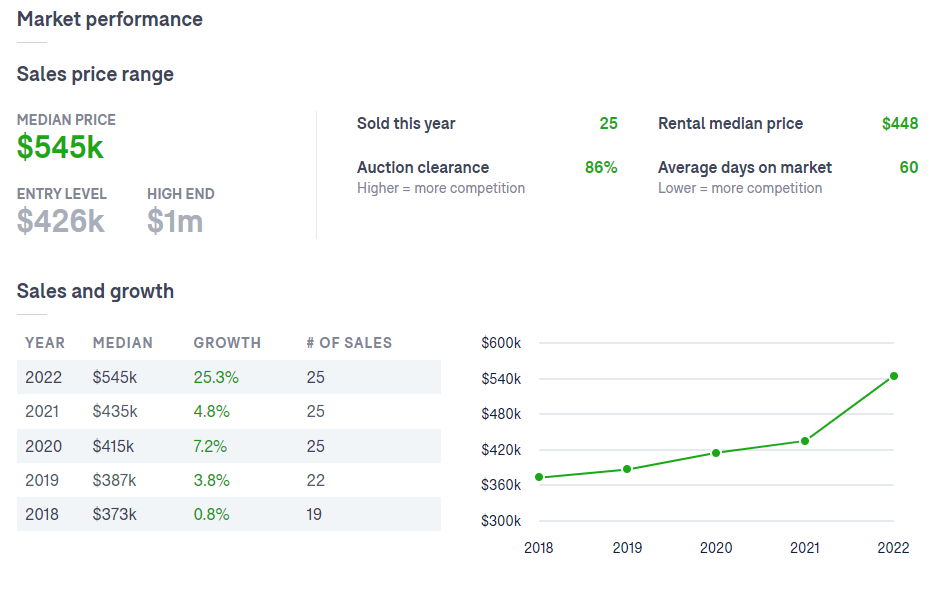
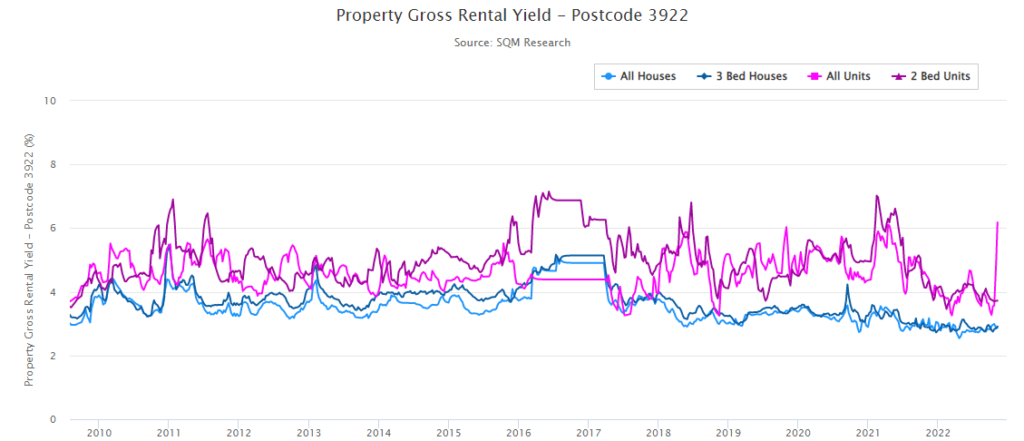
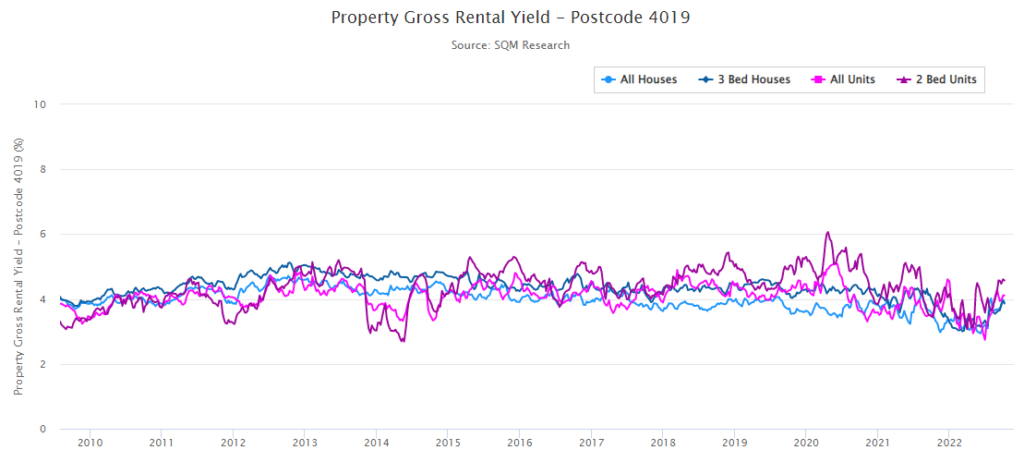
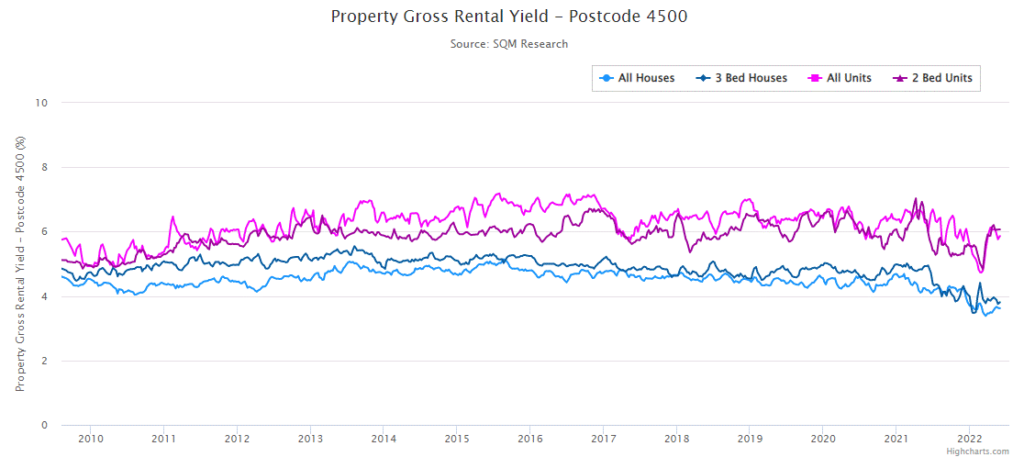
Gross Rental Yield
The Gross Rental Yield for all houses in Osborne is currently 4.2%.

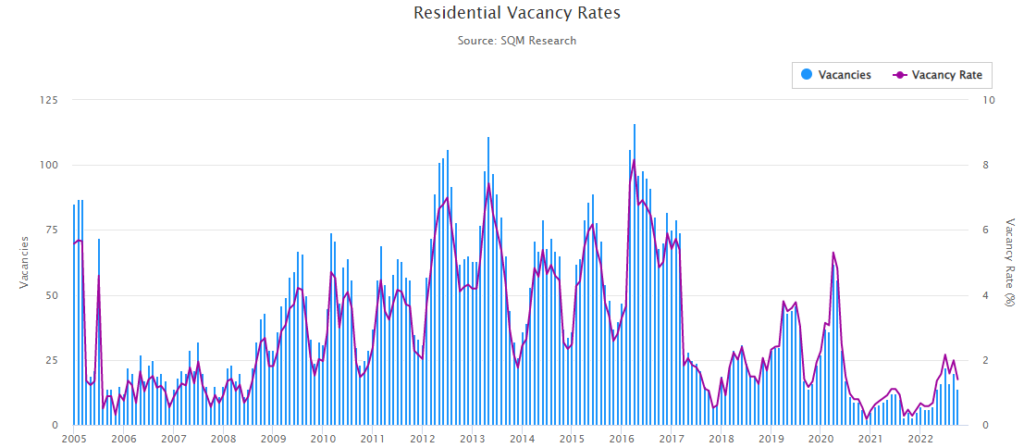
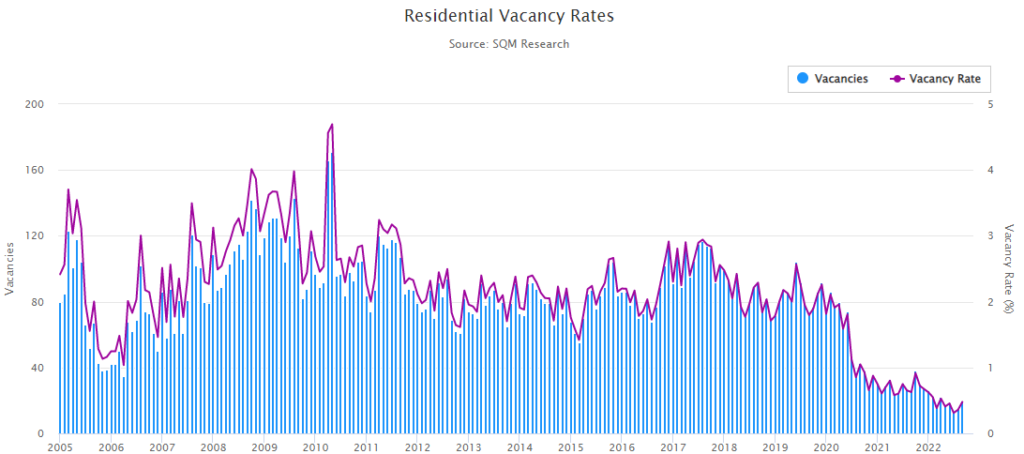
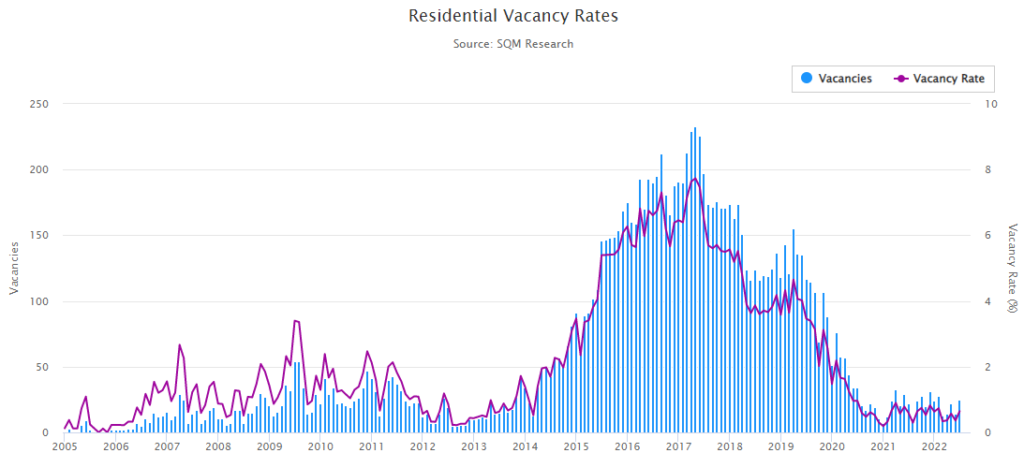
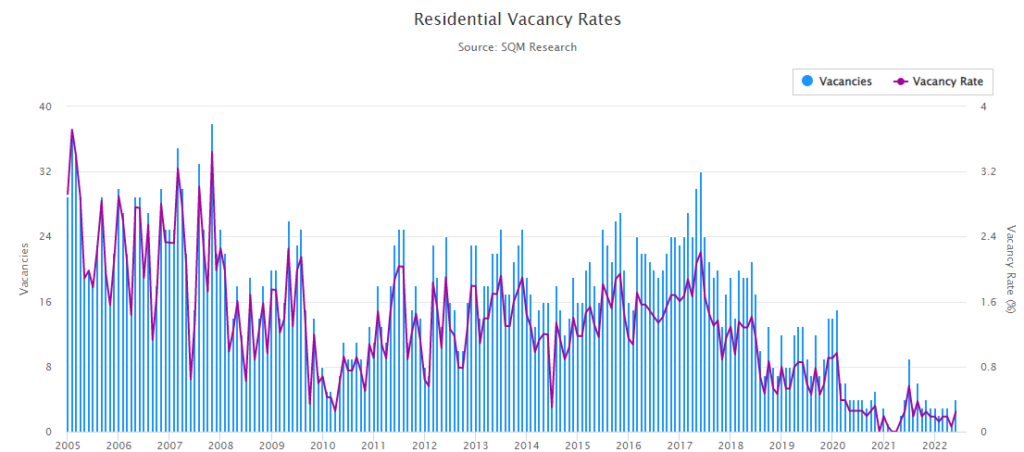
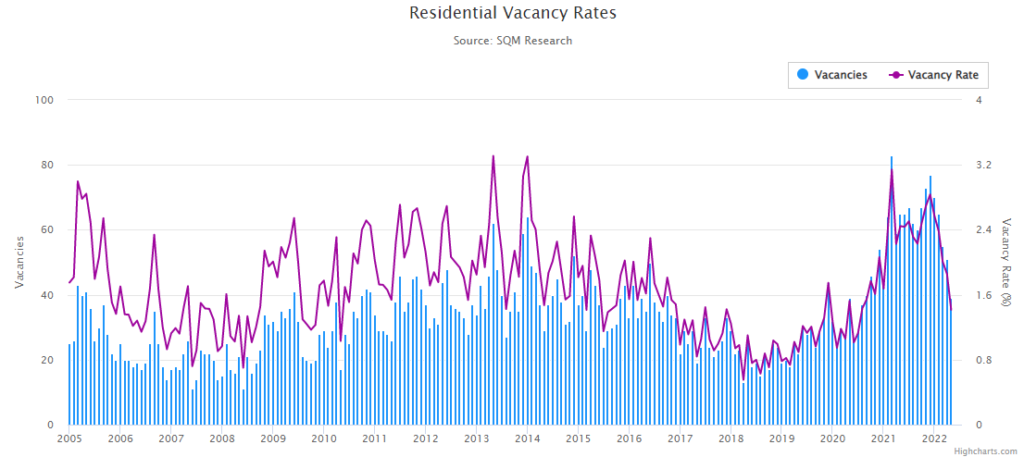
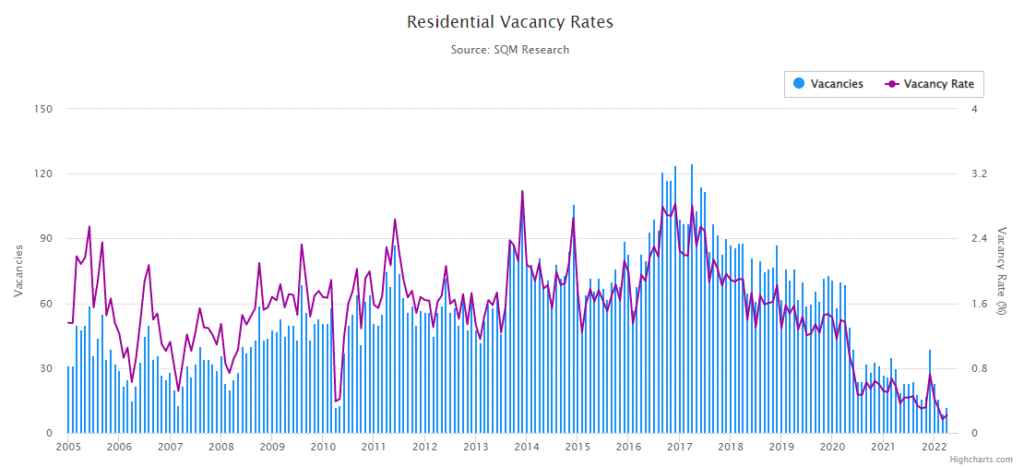
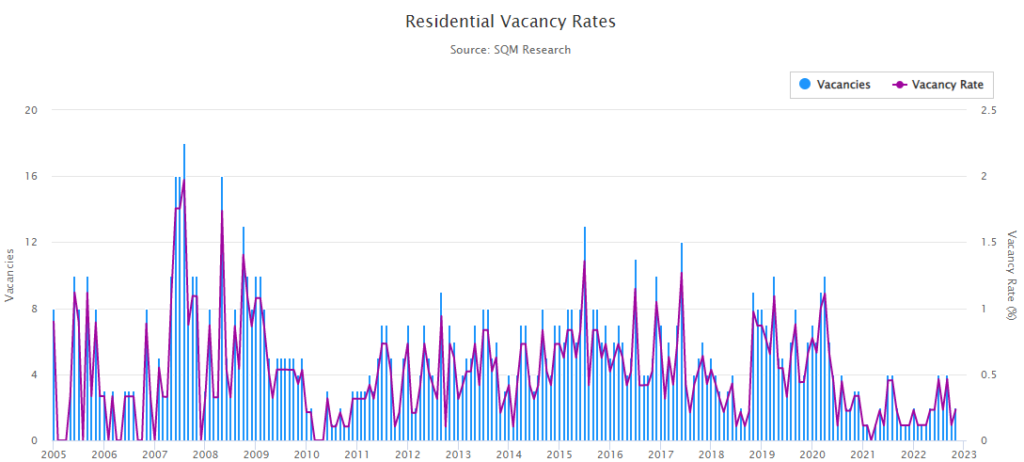
Residential Vacancy Rates
The Residential Vacancy Rate for all properties in the suburb of Osborne is 0.2%.
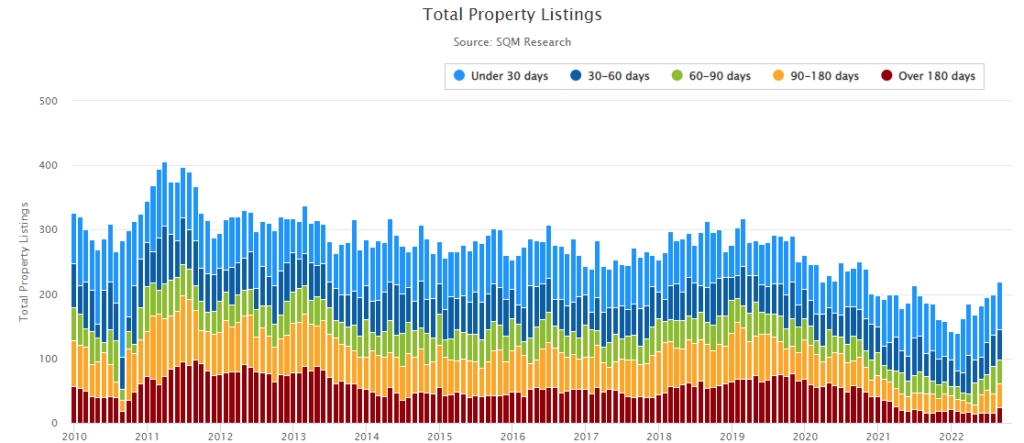
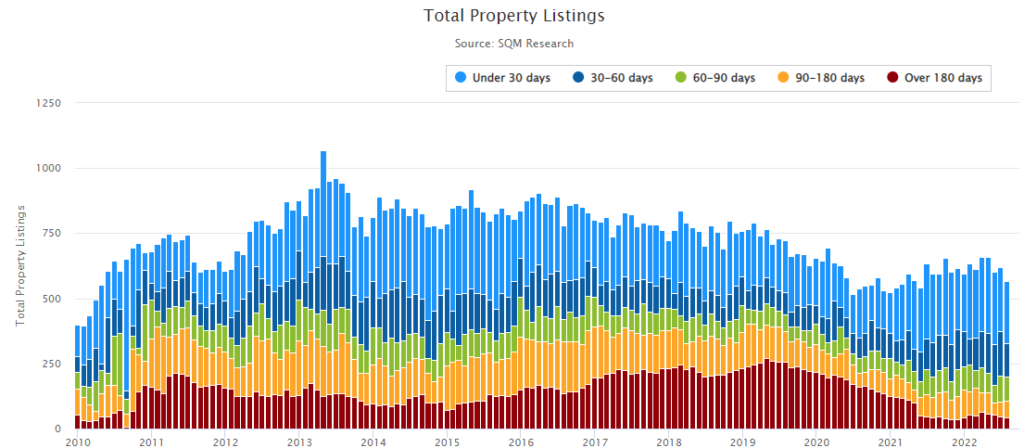
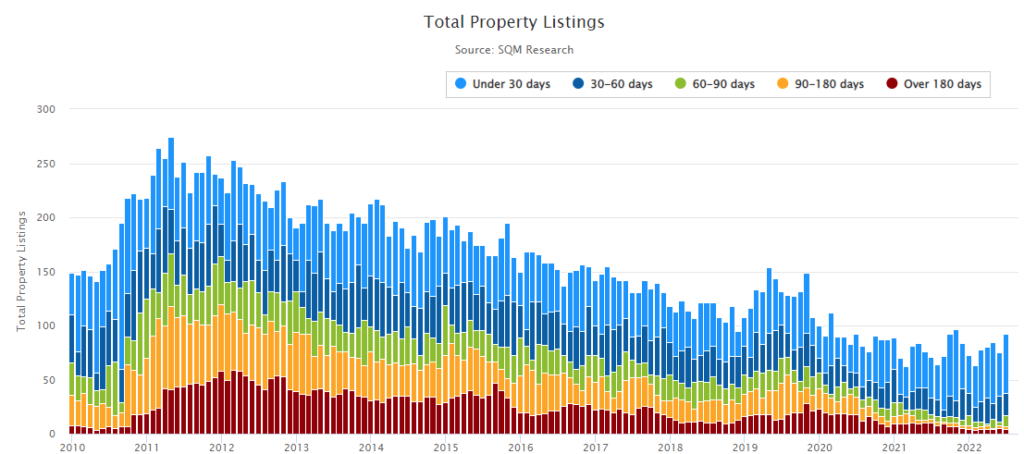
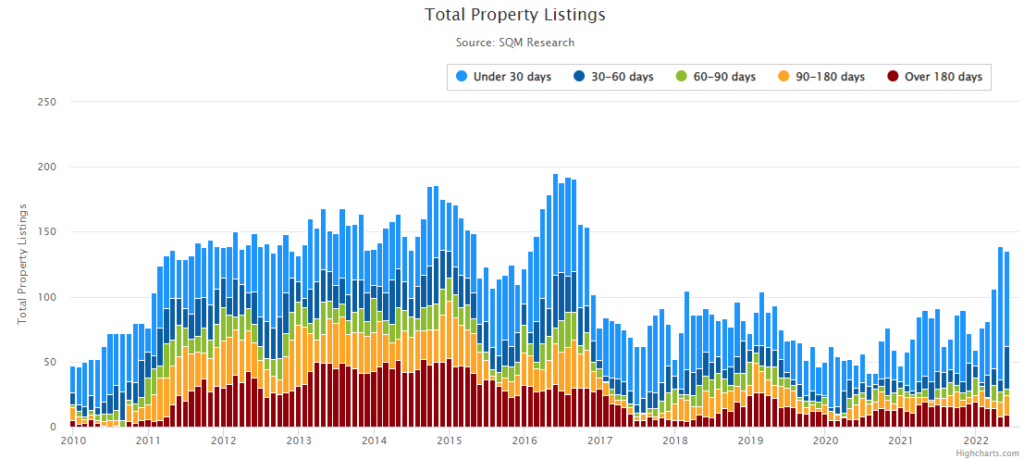
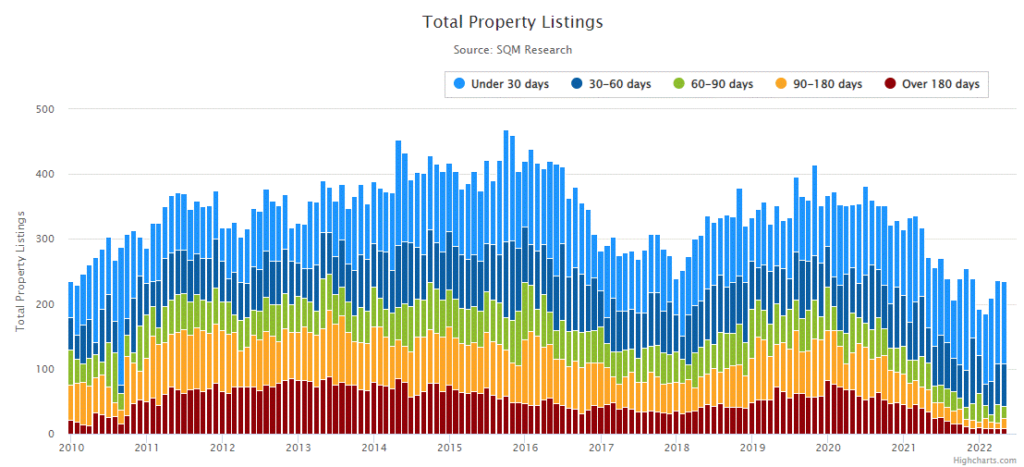
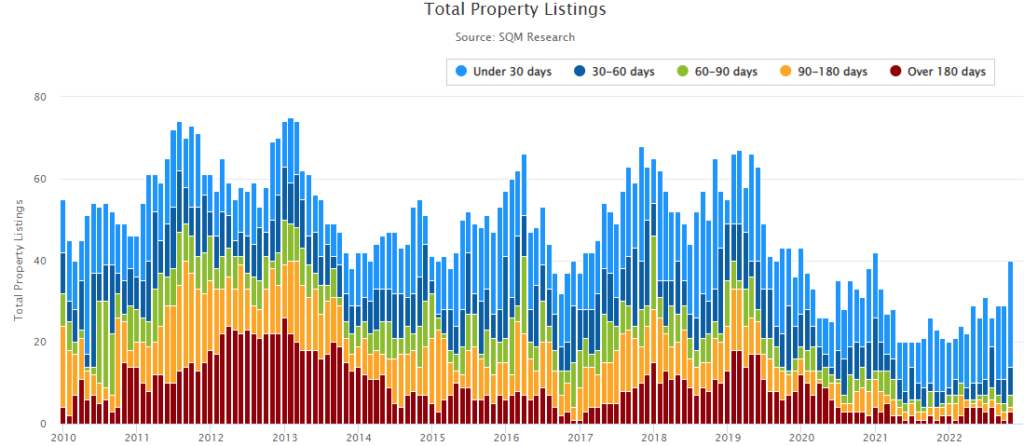
Stock on Market
Total property listings and time on the market for Osborne can be seen in the chart below.
To review the data above in detail, feel free to explore the ABS, Domain and SQM Research.
You can find previously completed Suburb Spotlights here.