The Australian property market continues to be the principal asset class of choice for Australians with 56.1% of household wealth held in housing at a total estimated value of $9.4 Trillion. This is greater than the combined value of Australian Superannuation, Australian Listed Stocks and Commercial Real Estate.
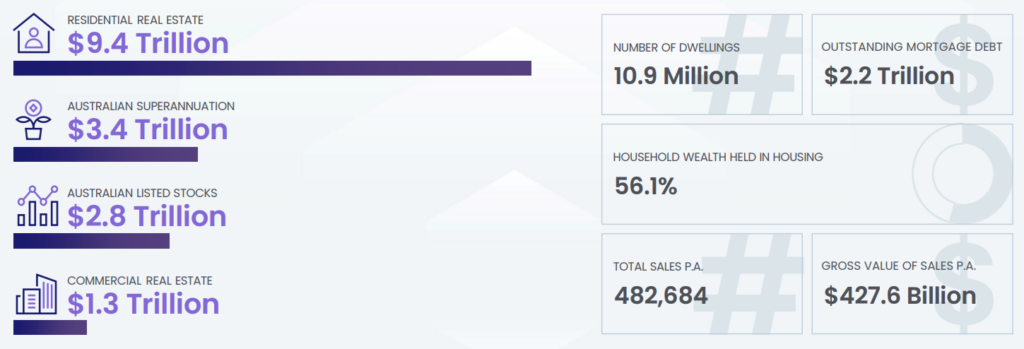
Furthermore, with outstanding mortgage debt at $2.2 Trillion, the Australian Residential Real Estate Market has a Loan to Value Ratio (LVR) of 23.4%.
According to CoreLogic, median dwelling values for the Australian property market in the 8 capital cities as of 30 April 2023 were as follows:
| Sydney | Melbourne | Brisbane | Adelaide | Perth | Hobart | Darwin | Canberra |
| $1 031 138 | $751 125 | $705 016 | $650 981 | $572 837 | $648 811 | $484 483 | $839 732 |
Whilst Sydney continues to have the highest median dwelling value, it is worth noting that despite having the 4th largest population of all the capital cities, Perth's median value ranks 7th overall. This is approximately 56% of the value of Sydney's median dwelling value, and a staggering $75 974 less than Hobart's median dwelling value which has approximately 10 times less the population of Perth.

Combined capitals (0.7% increase) outperformed combined regionals (0.1% increase) during April 2023. The Sydney (1.3%) and Perth (0.6%) markets led the way. In the regional market, the Regional South Australian (0.9%) and Regional Queensland (0.8%) markets recorded the largest increases in dwelling values.
Combined capitals (1.4% increase) outperformed combined regionals (0.1% decrease) during the past 3 months to May 2023. The Regional South Australian (2.4%) and Regional Western Australian (1.2%) property markets were the top performers. In the capital city market, Sydney (3.0%) and Perth (1.0%) outperformed their peers, whilst Hobart (-2.4%) and Darwin (-2.0%) both experienced a reduction in dwelling values over the quarter.
Combined regionals (6.8% decrease) outperformed combined capitals (8.4% decrease) during the past 12 months to May 2023. The Regional South Australian (10.0%) and Regional Western Australian (3.7%) property markets recorded the highest levels of growth. In the capital city market, Perth (1.3%) and Adelaide (1.3%) were the standouts, whilst Hobart (-12.7%) and Sydney (-10.7%) experienced the largest decreases in dwelling values over the past year.
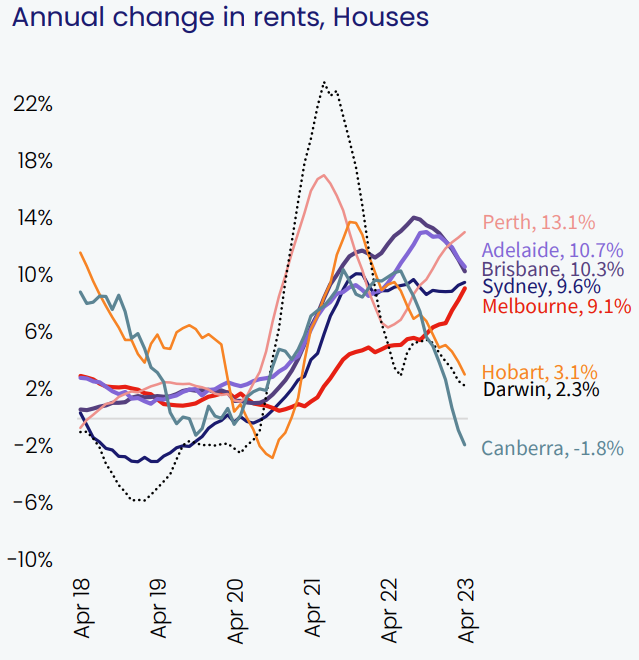
The Perth housing rental market continues to charge ahead with a 13.1% growth in rents over the past year. Adelaide (10.7%) and Brisbane (10.3%) have also experienced substantial growth in rents for houses over the preceding 12 months.
The Canberra market has turned negative (-1.8%) over the past 12 months. Darwin (2.3%) and Hobart (3.1%) are at the lower end of rental growth.
The Sydney unit rental market has outperformed all other capital cities, experiencing a 19.1% growth in rents over the past year. Continued pressure is currently being placed on this market from record levels of post-pandemic immigration. Brisbane (16.5%) and Melbourne (15.2%) have also seen substantial growth in rents for units over the preceding 12 months.
Similarly to housing rents, Canberra has experienced more moderate growth of 2.4% in unit rents over the previous 12 months. Darwin (7.0%) and Hobart (7.2%) have continued their annual increase, roughly in line with the economy's broader level of inflation.

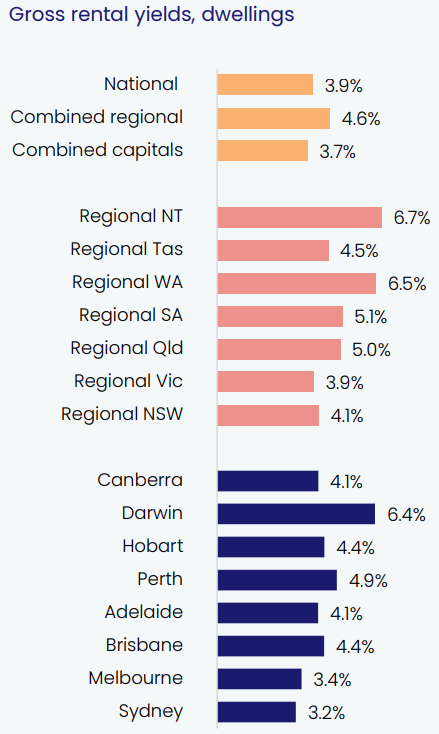
Combined regional yields (4.6%) continue to be higher than combined capital gross yields (3.7%).
Regional Northern Territory (6.7%) and Regional Western Australia (6.5%) collectively have the highest gross rental yields, whilst Regional Victoria (3.9%) and Regional New South Wales (4.1%) have the lowest yields.
Amongst the capital cities, Darwin (6.4%) and Perth (4.9%) continue to offer the best opportunities for investors to purchase positive to neutrally geared property. On the opposite end of the spectrum, Sydney (3.2%) and Melbourne (3.4%) continue to offer the lowest gross rental yields.
Find the full version of the National Media Release by CoreLogic here.
You can find the Property Market Update for April 2023 here.
