The Australian property market continues to be the principal asset class of choice for Australians with 56.6% of household wealth held in housing at a total estimated value of $9.97 Trillion. This is greater than the combined value of Australian Superannuation, Australian Listed Stocks and Commercial Real Estate.
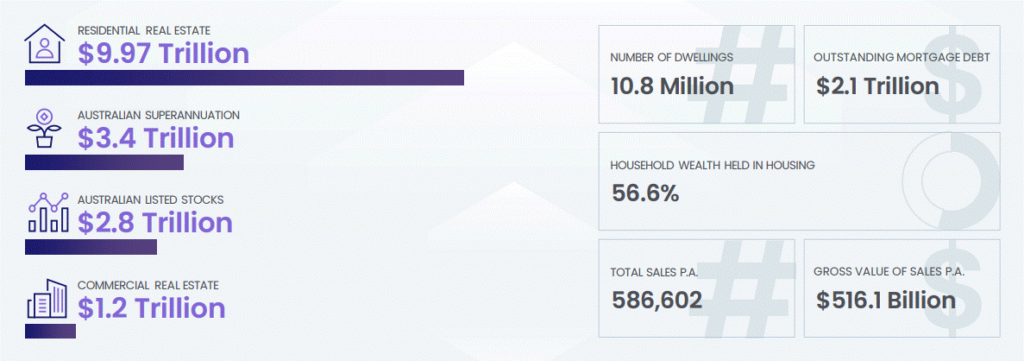
Furthermore, with outstanding mortgage debt currently at $2.1 Trillion, the Australian Residential Real Estate market has a Loan to Value Ratio (LVR) of 21.1%. Contrary to many mainstream media headlines, the overall market's LVR is not what would be considered to be at critically dangerous levels.
According to CoreLogic, median dwelling values for the Australian property market in the 8 capital cities as at 31 May 2022 were as follows:
| Sydney | Melbourne | Brisbane | Adelaide | Perth | Hobart | Darwin | Canberra |
| $1 120 836 | $806 196 | $779 895 | $628 744 | $555 538 | $738 399 | $504 306 | $940 026 |
Whilst Sydney continues to have the highest median dwelling value, it is worth noting that despite having the 4th highest population of all the capital cities, Perth's median dwelling value ranks 7th overall. This is approximately 50% of the value of Sydney's median dwelling value, and a staggering $182 861 less than Hobart's median dwelling value which has approximately 10 times less than the resident population of Perth.
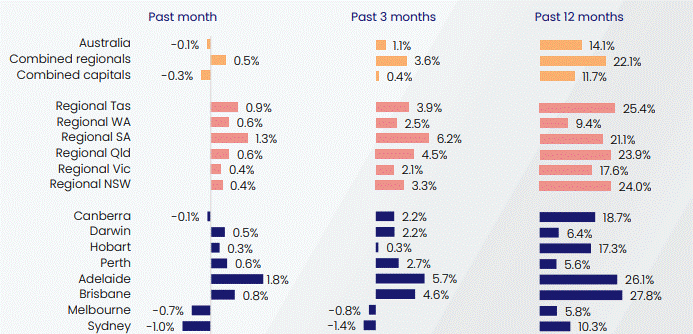
Combined regionals (0.5% increase) outperformed combined capitals (0.3% decrease) during May 2022. The Regional South Australia (1.3%) and Regional Tasmania (0.9%) property markets each led the way. In the capital city market, Adelaide (1.8%) and Brisbane (0.8%) continued their impressive recent run, whilst Sydney (-1.0%) and Melbourne (-0.7%) experienced a decrease in dwelling values.
Combined regionals (3.6% increase) outperformed combined capitals (0.4% increase) during the past 3 months to May 2022. The Regional South Australian (6.2%) and Regional Queensland (4.5%) property markets were the top performers. In the capital city market, Adelaide (5.7%) and Brisbane (4.6%) outperformed their peers, whilst Sydney (-1.4%) and Melbourne (-0.8%) both experienced a reduction in dwelling values over the quarter.
Combined regionals (22.1% increase) outperformed combined capitals (11.7% increase) during the past 12 months to May 2022. The Regional Tasmanian (25.4%) and Regional New South Wales (24.0%) property markets recorded the highest levels of growth. In the capital city market, Brisbane (27.8%) and Adelaide (26.1%) were the standouts, whilst Perth (5.6%) and Melbourne (5.8%) experienced the lowest level of increases in dwelling values over the past year.
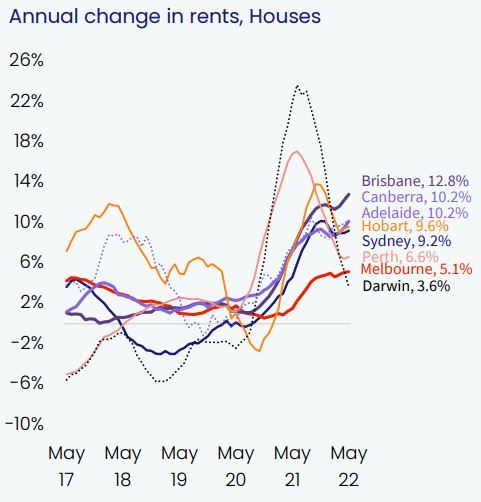
The Brisbane housing rental market continues to charge ahead with a 12.8% growth in rents over the past year. Canberra (10.2%) and Adelaide (10.2%) have also experienced substantial growth in rents for houses over the proceeding 12 months. This trend appears to be re-gathering the momentum that was lost in the later part of 2021 and early 2022.
The Darwin housing rental market has been more subdued, growing at 3.6% over the previous 12 months. Melbourne (5.1%) and Perth (6.6%) are also starting to see a slight upswing in rents for houses.
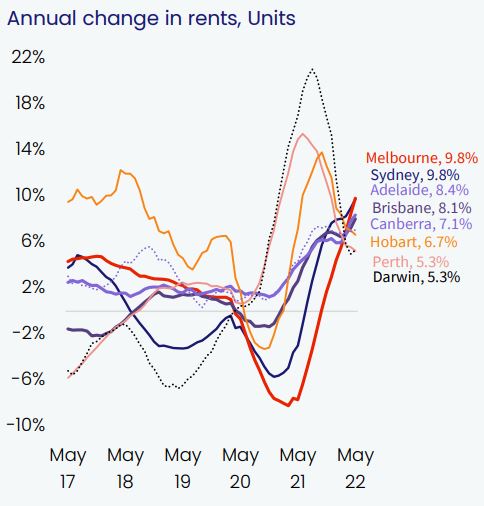
The Melbourne and Sydney unit rental markets have outperformed all other capital cities, each experiencing a 9.8% growth in rents over the past year. Continued pressure will be placed on these markets as international borders continue to open globally and migrant returns to pre-pandemic levels. Adelaide (8.4%) and Brisbane (8.1%) have also seen substantial growth in rents for units over the preceding 12 months.
Similarly to housing rents, Darwin has experienced more moderate growth of 5.3% in unit rents over the previous 12 months. Perth (5.3%) and Hobart (6.7%) although continuing their annual increase, continue to show a decreasing trend in rents for units.
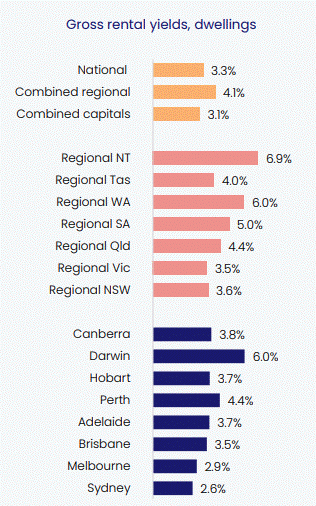
Combined regional gross yields (4.1%) continue to be higher than combined capital gross yields (3.1%).
Regional Northern Territory (6.9%) and Regional Western Australia (6.0%) collectively have the highest regional gross yields, whilst Regional Victoria (3.5%) and Regional New South Wales (3.6%) have the lowest yields.
Amongst the capital cities, Darwin (6.0%) and Perth (4.4%) continue to offer the best opportunities for investors to purchase a positive to neutrally geared property. On the opposite end of the spectrum, Sydney (2.6%) and Melbourne (2.9%) continue to offer the lowest gross rental yields.
Find the full version of the National Media Release by CoreLogic here.
