The Australian property market continues to be the principal asset class of choice for Australians with 57.8% of household wealth held in housing at a total estimated value of $9.6 Trillion. This is greater than the combined value of Australian Superannuation, Australian Listed Stocks and Commercial Real Estate.

Furthermore, with outstanding mortgage debt currently at $2.1 Trillion, the Australian Residential Real Estate Market has a Loan to Value Ratio (LVR) of 21.9%. Contrary to many mainstream media headlines, the overall market's LVR is not what would be considered to be at critically dangerous levels.
According to CoreLogic, median dwelling values for the Australian property market in the 8 capital cities as at 31 October 2022 were as follows:
| Sydney | Melbourne | Brisbane | Adelaide | Perth | Hobart | Darwin | Canberra |
| $1 036 727 | $767 117 | $728 615 | $654 079 | $559 043 | $696 334 | $507 081 | $876 567 |
Whilst Sydney continues to have the highest median dwelling value, it is worth noting that despite having the 4th largest population of all the capital cities, Perth's median dwelling value ranks 7th overall. This is approximately 54% of the value of Sydney's median dwelling value, and a staggering $137 291 less than Hobart's median dwelling value which has approximately 10 times less the population of Perth.
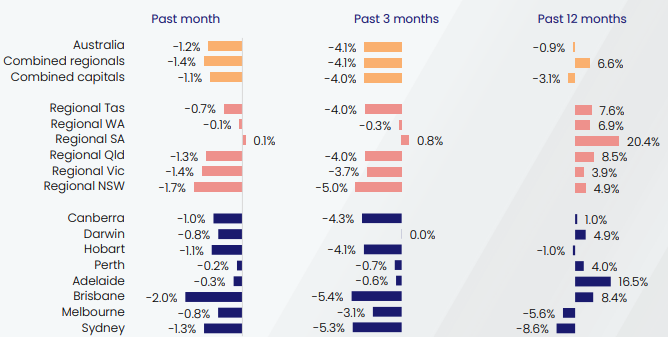
Combined capitals (1.1% decrease) outperformed combined regionals (1.4% decrease) during October 2022. The Regional South Australian (0.1%) market led the way. In the capital city market, no markets experienced growth, whilst Brisbane (-2.0%) and Sydney (-1.3%) experienced the largest decreases in dwelling values.
Combined capitals (4.0% decrease) outperformed combined regionals (4.1% decrease) during the past 3 months to October 2022. The Regional South Australian property market was the top performer. In the capital city market, Darwin (0.0%) outperformed its peers, whilst Brisbane (-5.4%) and Sydney (-5.3%) both experienced a reduction in dwelling values over the quarter.
Combined regionals (6.6% increase) outperformed combined capitals (3.1% decrease) during the past 12 months to October 2022. The Regional South Australian (20.4%) and Regional Queensland (8.5%) property markets recorded the highest levels of growth. In the capital city market, Adelaide (16.5%) and Brisbane (8.4%) were the standouts, whilst Sydney (-8.6%) and Melbourne (5.6%) experienced decreases in dwelling values over the past year.
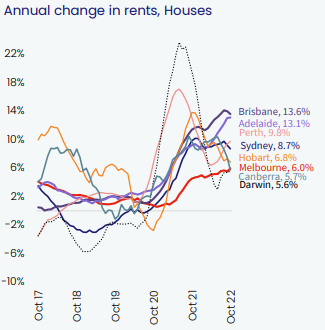
The Brisbane housing rental market continues to charge ahead with a 13.6% growth in rents over the past year. Adelaide (13.1%) and Perth (9.8%) have also experienced substantial growth in rents for houses over the preceding 12 months.
The Darwin housing rental market has been more subdued, growing at 5.6% over the previous 12 months. Canberra (5.7%) and Melbourne (6.0%), although at the lower end of rental growth, are also seeing healthy increases in rents for houses.
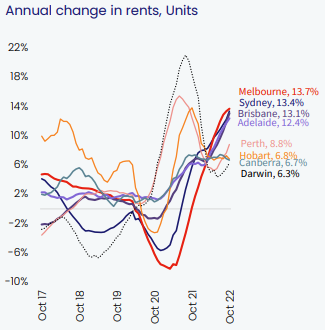
The Melbourne unit rental market has outperformed all other capital cities, experiencing a 13.7% growth in rents over the past year. Continued pressure will be placed on this market as international borders continue to open globally and immigration returns to pre-pandemic levels. Sydney (13.4%) and Brisbane (13.1%) have also seen substantial growth in rents for units over the preceding 12 months.
Similarly to housing rents, Darwin has experienced more moderate growth of 6.3% in unit rents over the previous 12 months. Canberra (6.7%) and Hobart (6.8%) have continued their annual increase, roughly in line with the economy's broader level of inflation.
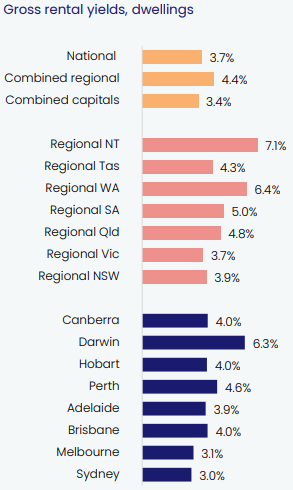
Combined regional yields (4.4%) continue to be higher than combined capital gross yields (3.4%).
Regional Northern Territory (7.1%) and Regional Western Australia (6.4%) collectively have the highest regional gross yields, whilst Regional New South Wales (3.9%) and Regional Victoria (3.7%) have the lowest yields.
Amongst the capital cities, Darwin (6.3%) and Perth (4.6%) continue to offer the best opportunities for investors to purchase positive to neutrally geared property. On the opposite end of the spectrum, Melbourne (3.1%) and Sydney (3.0%) continue to offer the lowest gross rental yields.
Find the full version of the National Media Release by CoreLogic here.
You can find the Property Market Update for October 2022 here.
